


Infographic design: how to use it to drive traffic and backlinks
Generating traffic and acquiring backlinks are the two biggest challenges that every business face. I have seen web masters hitting their heads hard on the walls because they aren’t seeing enough traffic to their websites.
I know how it feels.
What if you can get traffic and natural backlinks with a single technique that has proven to work over and over again?
Ever heard of infographics?
Large and small brands use infographics to drive massive traffic and to gain natural backlinks.
The guide below will show you how you can replicate the same technique.
What is an infographic?
Wikipedia defines an infographic as a visual representation of data aimed to present information quickly and clearly. An information which could be hard to digest gets a whole lot easier if it’s represented visually in the form of charts, graphs, images, etc.
This is what infographics do.

Why design infographics?
There are several reasons why you should design and market infographics. Let’s see why every business needs infographics:
- Infographics are easy-to-read. Scanning gets easier with infographics.
- Being colourful, they’re always visually appealing.
- Infographics have this amazing ability to go viral. They’re easy-to-share and most of them come with embed codes, therefore, sharing them is easier than ever.
- They’re best at driving traffic to your website.
- They’re exceptionally great for brand awareness. You’ll hardly see an infographic without a business’s logo.
- Perhaps the best reason why your business should design infographics is that they help you generate backlinks – naturally. Everyone who will share the infographic through your embed code, you’ll get the credit and a natural backlink.
To shed more light on that, let’s briefly discuss the benefits.
Five benefits of infographics
If you decide to design infographics, what benefits will you receive?
An infographic has five major benefits for your business.
1. It drives free traffic
The number one benefit of an infographic is that it helps you drive massive free traffic to your website irrespective of your industry.
KISSmetrics created 47 infographics in two years. They received 2,512,596 visitors from these 47 infographics in two years.
In another case study, a local infographic generated 25K visits in 10 days.
If you’re struggling to drive targeted traffic to your website, there couldn’t be any easier technique to generate heaps of traffic.
2. Free natural backlinks
WordStream received backlinks from some high authority websites after they started creating infographics. The sites include CNN, Fortune, Wikipedia, Privacy.org, Techcrunch, and many others.
The best thing about all these links is that they’re natural backlinks which search engines love. You’ve earned these links and there’s no way you’ll ever get penalised for these links.
KISSmetrics generated 41,142 backlinks from 3,741 unique domains from those 47 infographics. Remember, this was achieved in only two years.
Imagine if you have to create over 41K backlinks in two years naturally, it seems to be something impossible to do unless you go for pure black-hat SEO.
These backlinks help drive traffic by improving the search engine ranking of your website.
3. Infographics are affordable
Now, this should be surprising considering the two benefits stated above. I mean if you can generate traffic instantly and you can get backlinks naturally, it must be something very expensive.
After all, getting a backlink from CNN or Fortune isn’t cheap.
Guess what, creating a high-quality infographic is cheap.
An infographic won’t cost you more than $600. This is the average cost per infographic that KISSmetrics paid for those 47 infographics.
You get several backlinks from authority websites, instant traffic, and leads by spending $600 – not a bad deal.
You can use free tools like infogr.am, easel.ly, and piktochart.com to create an infographic in-house. Or you can hire a professional designer to handle it for you.
If you do it yourself, you can create an infographic under $100. If you choose to hire a professional, it will cost you somewhere around $500 per infographic.
The best part is that the success of an infographic isn’t associated with its cost. Even a cheap $200 infographic has the potentials to get you links from some top authority websites if you promote it.
4. Infographics get more shares
Visual content is more likely to go viral on social networks as compared to text. Your infographic is a combination of multiple images, graphs, and charts, therefore, it’s most likely to go viral.
Even if it doesn’t go viral, it will attract some decent shares and likes on social networks.
For instance, KISSmetrics 47 infographics received over 41K tweets and over 20K likes. The local infographic received over 3K engagement on Facebook and 245 tweets.
These numbers are quite encouraging keeping in view the cost of creating an infographic.
5. Best for brand awareness
Brand awareness becomes a piece of cake with infographic marketing. Every time your infographic is shared, linked to, or is read it increases brand awareness.
Your business is seen by hundreds if not thousands of eyeballs.
The best approach to get brand awareness is to clearly mention your brand name or logo on the infographic so that it gets all the exposure it deserves.

Seven steps to use infographics to drive traffic and backlinks
Getting started with infographic marketing isn’t that hard. If you haven’t created any infographic in the past and this is your first time, the following 7-step guide will put you on the right track.
Follow each step to generate traffic and acquire backlinks from your infographics like pros.
Step 1: Research viral ideas
Finding viral ideas for your infographic is the first step.
In order to make your infographic viral, you have to see what type of infographics, images, videos, and other content types in your niche go viral.
There are multiple techniques to find the best viral ideas for your infographic.
a) Long-tail keywords: Long-tail keywords are your best friend. Let’s jot down a few long-tail keywords.
Head to Google Trends and enter your primary keyword. It could be anything related to your niche but it has to be niche-specific.
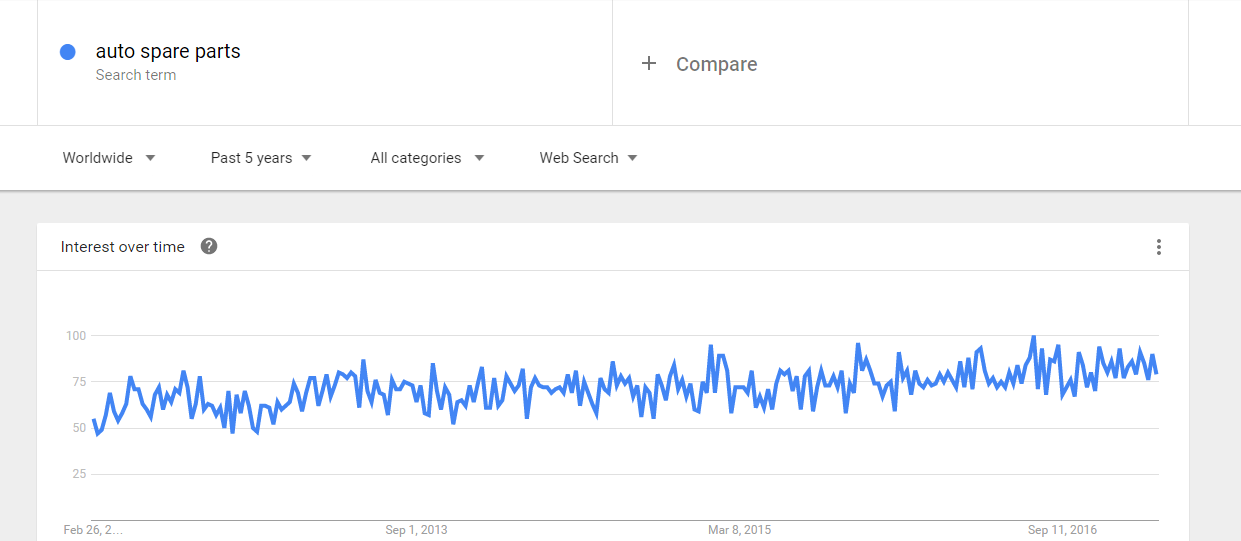
The Google Trends will give you a nice overview of interest over time. Choose a few keywords with fairly decent interest over time.
Take these keywords to Google Keyword Planner tool to generate more ideas and to see the competitiveness of the keywords.
Using infographic with the long-tail keyword will give you more specific monthly searches.
You can use ‘long-tail keyword + infographic’ in Google search to find existing infographics on the same keyword.
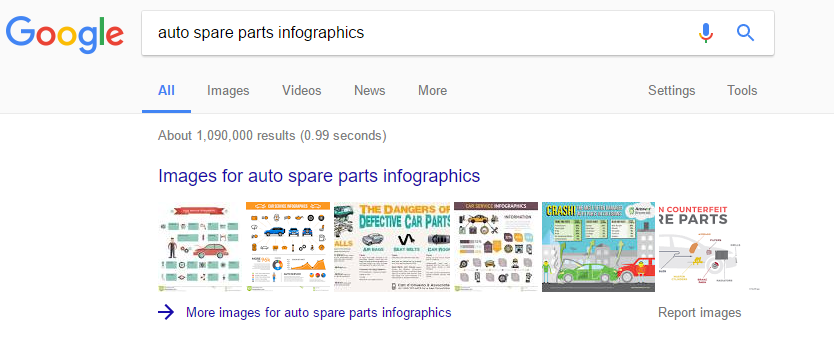
The best approach is to choose a long-tail keyword that has no infographics. This improves the chances of your infographic getting viral because it will be the only infographic for that keyword.
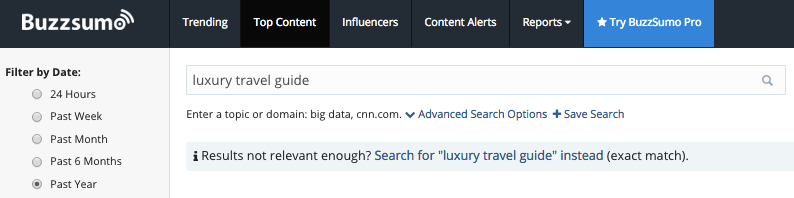
b) Buzzsumo: Buzzsumo is a great tool that will help you find the most shared content on the internet. This is the easiest approach to finding viral ideas for your infographic because it will be based on a content idea that has already proved to be the best.
Click Top Content inside Buzzsumo dashboard and enter a keyword. Use the best long-tail keyword that you identified in the previous step (from Google Trends and Keyword Planner).
You’ll see lots of results. You can see which type of content is most shared and on which networks.
This will help you identify the type of infographic for instance, should you make it a how-to infographic, a guide, a list, or something else?
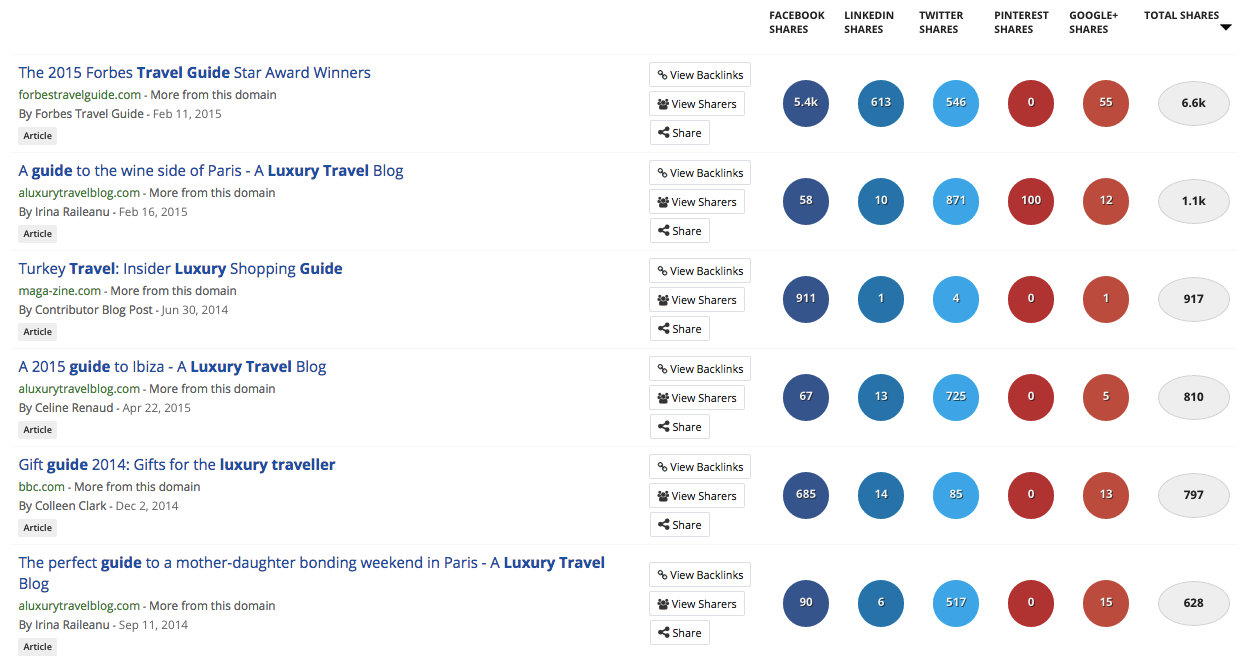
Click Views Shares to get more details about the shares and social activity related to that piece.
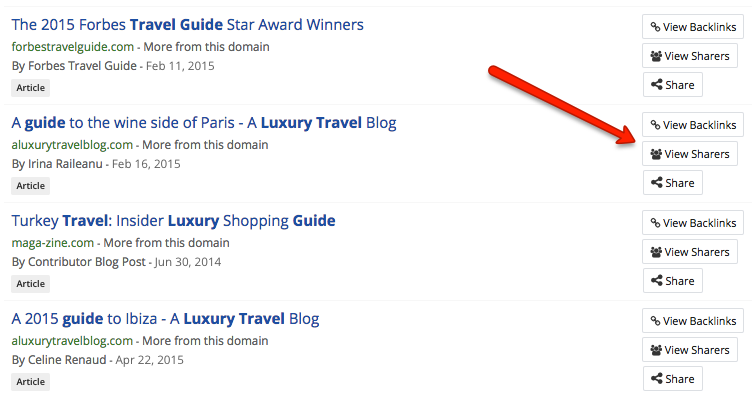
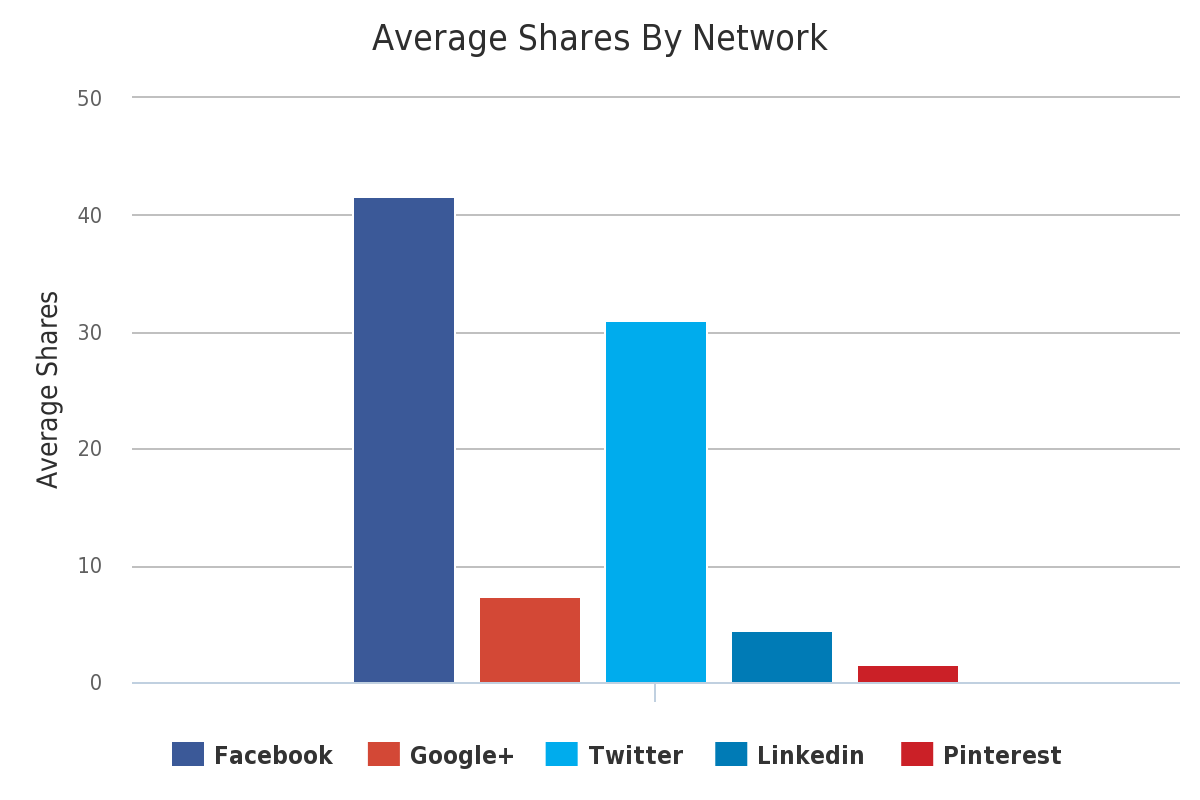
You can download a Content Analysis report that will give you more details about the types of shares and social networks.
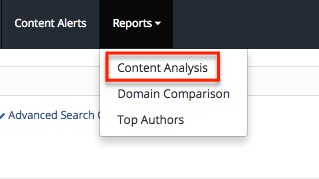
A report like this will help you identify the best social network for your infographic and where it is most likely to get viral.
c) Latest news: You can use the latest news to generate ideas for your new infographic. Combining a current yet hot news story with your brand and creating an interesting infographic based on the same is one of the easiest ways to make it viral.
When the Kate Winslet story was going viral where she saved Richard Bronson’s mother during a house burn, London Fire Brigade use the viral story and offered a training session to Kate.
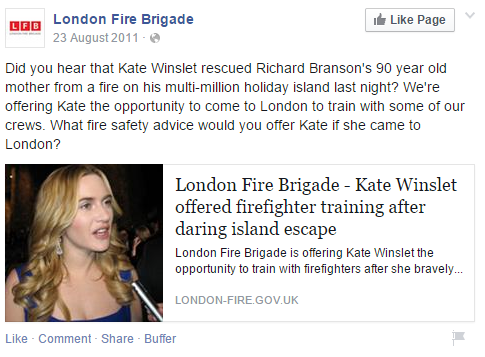
It’s tricky but it works.
- Find latest stories that are getting viral or are expected to go viral.
- Choose a story that is most related to your brand.
- Generate themes and see how you can link the news story with your brand or a product.
- Find statistics and get to work.
Step 2: Designing your infographic
There are two ways to design your infographic:
- DIY
- Hire a professional [FabrikBrands.com can help you]
If you can design an infographic yourself and know how it works, I’m sure you don’t need any details. But just to give you a jump start, here’s a guide on HubSpot on designing an infographic yourself. It will help you.
Alternately, you can hire a professional infographic designer to make your life easier.
There are two ways to hire a professional and experienced designer.
- FabrikBrands.
- Freelancing site.
a) FabrikBrands: Visit Fabrikbrands.com and speak to the experts about your infographic idea. Fabrik is more than a team of designer, it’s a branding agency in London.
They use insights and ideas as raw materials to power your brand and design infographics that will not only drive traffic through social media but it’ll also grow your client-base. Fabrik will listen to you, give you the best pricing based on the nature of your infographic project.
b) Freelancing websites: Trust me, using freelancing websites to find infographic designer is difficult. Yes, you’ll have the opportunity to post your job requirements and even choose hundreds of applicants, but how do you know the right designer to hire?
However, it doesn’t mean that sites like UpWork, People Per Hour, Guru, etc., are totally useless.
While some businesses have had success hiring designers from freelancing sites, others have been disappointed on several occasions.
To help you get started, you can use the following template.
Hello,
I am looking for an expert designer who can design a great infographic for me on [insert your topic here]. I’d like to hire someone who is experienced and have enough samples to share.
Please send samples with your application.
Thank you.
Set your budget. Keep it realistic. Don’t use $50 because you can expect quality work at that rate.
You can negotiate the price with the designers based on their skills. Put $200 to $500 in the estimated budget when posting a job.
Hire the best applicant.
While the infographic is being designed, you can create a social media launch plan for it.
Before you create a social posting calendar, you need to do two things:
a) Create a dedicated page for your infographic on your website’s blog. Randy Krum suggests that you should either create a dedicated landing page for your infographic or a separate blog post for it.
This makes analytics easy and it will help you send all the traffic to a single URL.
If you don’t need a dedicated landing page, create a new blog post for the infographic. It will help you calculate the ROI of the infographic at a later stage.
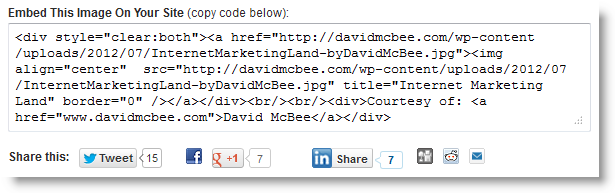
b) Use Siegemedia embed code generator to generate create an embed code your infographic that will make it super-easy to share.
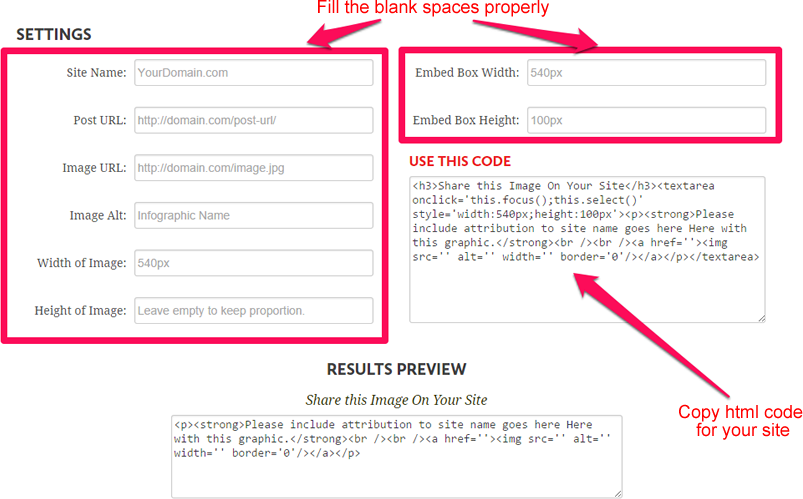
You can only generate it once you’ve created the landing page or the blog post so wait until you get the infographic. Take the code and paste it as HTML on the page.
This is how it will look.
Social media calendar for infographic
The success of your infographic launch is primarily associated with social networks. A single tweet or a one-time post on Facebook won’t do anything.
You need to create a social media editorial calendar.
Follow the steps below to create one:
- Decide on a posting frequency for your infographic. Use existing data of your social media accounts or use industry trends to see what is the best posting frequency.
- Choose the social networks to run your campaign. Make sure it includes Twitter, Facebook, Google+, Tumblr, Flickr, Pinterest, LinkedIn, and others.
- Use a tool like Sprout Social, Buffer, or HootSuite to schedule your posts for all these networks.
- Promote your infographic for a week or so on all the social networks.
Here’s an approach for Flickr, Pinterest, and Instagram that will help you create the necessary buzz. This is a pre-launch approach.
- Break your infographic into different segments and post each segment on these social networks daily.
- Once all the segments have been published, post the complete infographic with a link to your website.
This is a nice approach to keep your readers interested.
Step 3: Define objectives
So what do you actually want to achieve from your infographic?
Are you interested in driving massive traffic to your website?
Are you interested in acquiring backlinks to improve search engine ranking?
Do you want to generate leads?
Do you just want to increase brand awareness?
Get clear about the objective of the infographic and it should be pretty much clear– well before you start finding ideas for it.
You have to choose distribution channels, marketing tactics, and infographic idea based on the objective.
For instance, if you’re only interested in brand awareness, you must make sure that the infographic has your business logo, business name, and URL on the infographic. It must be clearly visible.
Similarly, if your intention is to acquire high-quality backlinks from top authority sites. You have to select a few authority websites, see what type of content the editors love, and choose an infographic topic that will appeal to these sites.
After publishing the infographic, reach out to these websites to offer your infographic.
It’s a good idea to choose a single objective for your infographic as this will keep you and your team focused.
Step 4: Choosing your distribution channel
You cannot distribute your infographic throughout the internet. You have to choose the best distribution channel that will serve your primary objective in the best possible way.
You’ve got to be where your audience is.
I have already talked about multiple social media networks and social media calendar but you don’t have to focus on all of them equally.
If your primary audience hangs out on Twitter, it should be your main distribution channel.
If they hang out on Instagram, post segments of your infographic on Instagram to drive traffic to the landing page.
If you don’t have any idea how to choose a distribution channel, refer to buyer personas. Decide with the buyer persona you’re targeting with the infographic. Then, see where it loves spending time.
That’s your main distribution channel.
The following image shows how all the four channels together help you distribute your content on the internet.
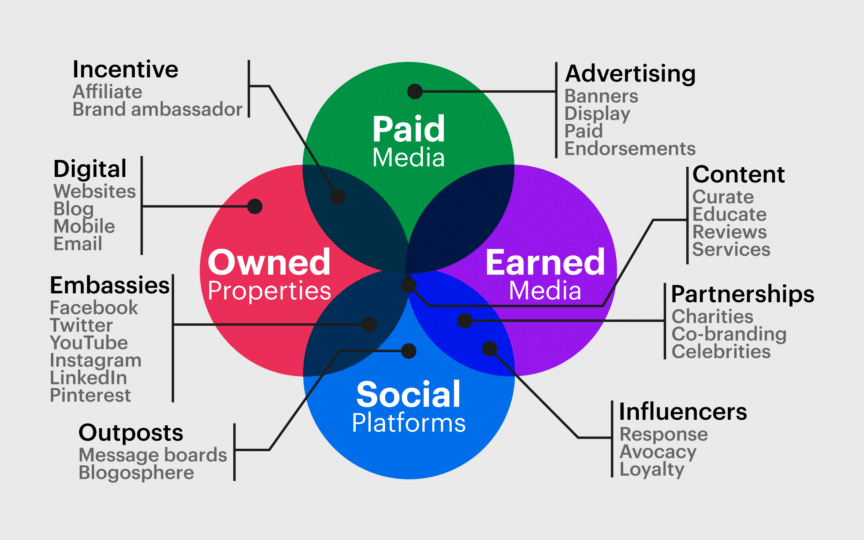
You can choose all the four but it is extremely unlikely that your target audience hangs out everywhere on the internet unless you’re promoting Facebook.
Get specific.
Step 5: Drive traffic with your infographic
Time to drive traffic with your infographic.
To do so, you’ve to distribute your infographic. Again, you’ve to choose the approach that best suits your business model and target audience.
You don’t have to follow all these approaches to driving traffic. Choose one or maybe two that are best for your target market.
1. Guestographic
Guestographic is a technique that is used for getting traffic as well as generating quality backlinks for any infographic is any niche. Brian Dean has used it several times to drive massive traffic to this infographics.
See how it works:
a) Find all the websites that write about the topic of your infographic. For instance, if your infographic is about blue cats, use Google to find some top websites/blogs that write about blue cats.
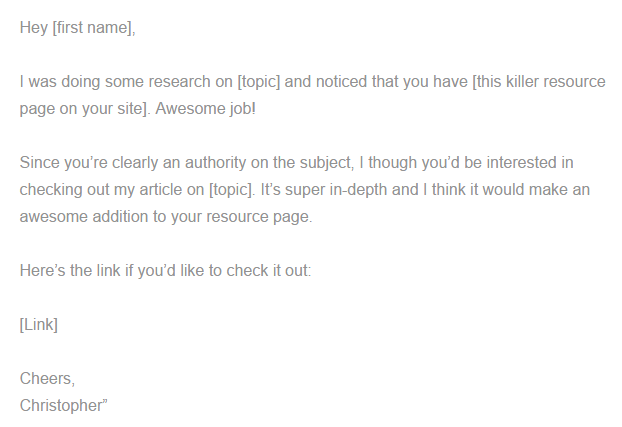
b) Send all such blogs an email about your infographic. Brian Dean uses the following template to send emails to web masters. You can use the same template.
c) Once you get a reply, send following email.
d) If you receive an email for a guest post, write a short 300+/- words guest post about the infographic and send it over.
e) You’ll get traffic from the blog and also a backlink if your request for the guest post is accepted.
This is a proven technique that will send heaps of free traffic to your landing page.
2. Influencer marketing
A rather difficult approach is to target influencers in your industry. You have to find a few key influencers in your market and target them.
Truth is, It’s a long-term strategy where you have to build a relationship with the influencer before you can pitch your infographic. You can’t do it all at once.
But an easy approach is to use Commun.it to find influencers who are already following you on Twitter and have engaged with you recently.
Pitch them your infographic and if they share it with their audience (which is your audience too), you’ll get lots of traffic.
KISSmetrics have a detailed guide on influencer marketing that will help you get better with it.
3. Guest blogging
Guest blogging is quite similar to guestographic. The difference, however, is that in guest blogging you write a post that may not be about the infographic but you will link to the infographic landing page from the author bio.
The idea is to drive traffic to your infographic from the guest post.
Follow these steps to find guest blogging opportunities:
- Find high-quality blogs especially those where your target audience hangs out.
- Send up to three different article titles for approval. Don’t send emails asking if they’re accepting guest posts. Pitch them with titles that will compel them to say yes.
- Craft a killer blog post on the topic that is approved and send it over.
- Share guest post on your social networks.
- Repeat the process. You’ll need multiple guest posts to promote a single infographic.
Use the following template for guest blogging.
Subject: You should blog about [insert your guest blog post topic]
[insert their first name], as an avid reader of [insert their site name] I would love to read about [insert guest blog post topic], and I think your readers would as well.
Your content on [insert existing post from their website #1, insert existing post from their website #2, and insert existing post from their website #3] is great, but I think you can tie it all together by blogging on [insert guest blog post topic].
I know you are probably busy and won’t blog about it, so I’m going to make you an offer you can’t refuse. How about I write it for you? Don’t worry, I’m a great blogger and have had my posts featured on [insert previous guest post URL #1] and [insert previous guest post URL #2].
Let me know if you are interested. I already know your blogging style, plus I understand what your readers love as I am one.
Look forward to hearing from you.
[insert your name]
4. Social media
This is the approach that has been discussed in Step 2 already.
The best place to promote your infographic is social networks. This is where your infographic and/or its segments are most likely to get viral.
5. Press release
Is your infographic fairly unique?
Is it something that the journalist will be interested in?
If so, a PR will do the trick.
This is an expensive approach because PR distribution isn’t free, so only use this technique if your infographic is based on a newsworthy story.
If your press release is picked up by a few journalist, it will have the same effect as that of an influencer marketing campaign.
Before you go ahead with the PR, read these 31 tips from experts.
6. Repurpose
Repurpose your infographic to make it suitable for all types of the target audience to increase its reach.
For instance, you can your infographic in segments and share individual segments on social networks for better reach.
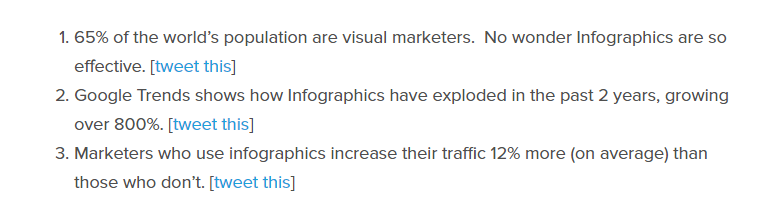
Alternately, you can use data points from your infographic shareable in the form of tweets like this.
You’ve got to figure out what works best for your target audience and then repurpose infographic accordingly.
7. Blogging
Blog religiously about your infographic.
This is one way to repurpose your infographic.
Here’s a nice approach that you can use.
- Choose one data point from your infographic and write a blog post on it.
- Link back to the infographic from the blog post and use its screenshot in the blog post.
- Repeat.
If your infographic has 20 data points, that’s 20 different blog posts all promoting the same infographic.
8. SEO
You can drive traffic from search engines to your infographic. You have to optimise your infographic to improve its search engine ranking.
Follow the steps below to improve its ranking.
- Write a keyword-focused title.
- Write high-quality content with the infographic. Add at least 300 words.
- Use ‘infographic’ in the title.
- Use heading tags, alt tags, and meta tag to optimise the infographic landing page.
- Acquire natural links to improve search engine ranking. The next step discusses in detail how to do it.
Step 6: Using infographic for link building
Use the following techniques to generate backlinks from the infographic.
1. Outreach campaign
This works quite similar to the Guestographic technique where you need to find bloggers that are most likely to share your infographic. Reach out to them, tell them about your infographic, and ask for a backlink.
This is the best approach to getting high-quality backlinks for your infographic.
2. Submit to infographic directories
There are several infographic directories and sites where you can submit your infographic for a quick backlink.
These sites and directories include:
- Slideshare
- Infographics Showcase
- Infographics Archive
- Scribd
- Submit Infographics
- Infographix Directory
- Graphs.net
Here’s a list of top 70 infographic directories.
Alternately, you can hire someone on Fiverr to submit your infographic on leading directories for $5.
3. Broken link building
This is a great strategy to build backlinks.
You have to find a broken link on a website, contact the owner, tell him about the broken link, offer your link as a replacement, and you’ll get a natural backlink.
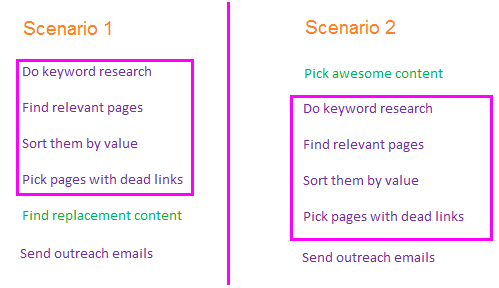
It is a time-consuming strategy so be prepared for it.
The guides at Moz and QuickSprout are the best in terms of finding broken links and getting them replaced.
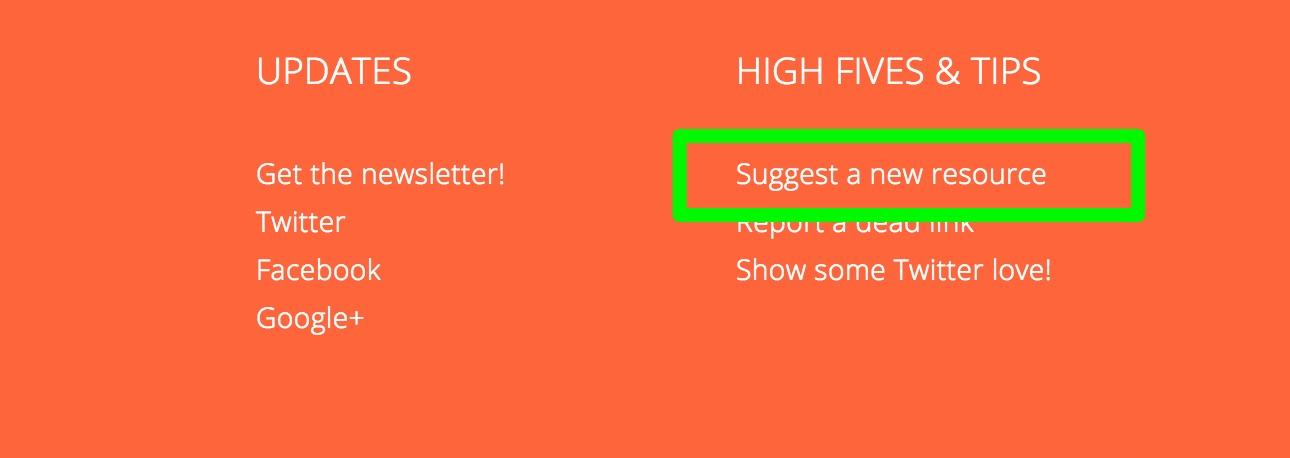
4. Resource page backlinks
This technique is similar to broken link strategy but in this case, you have to find resource pages that share links on topics related to your infographic.
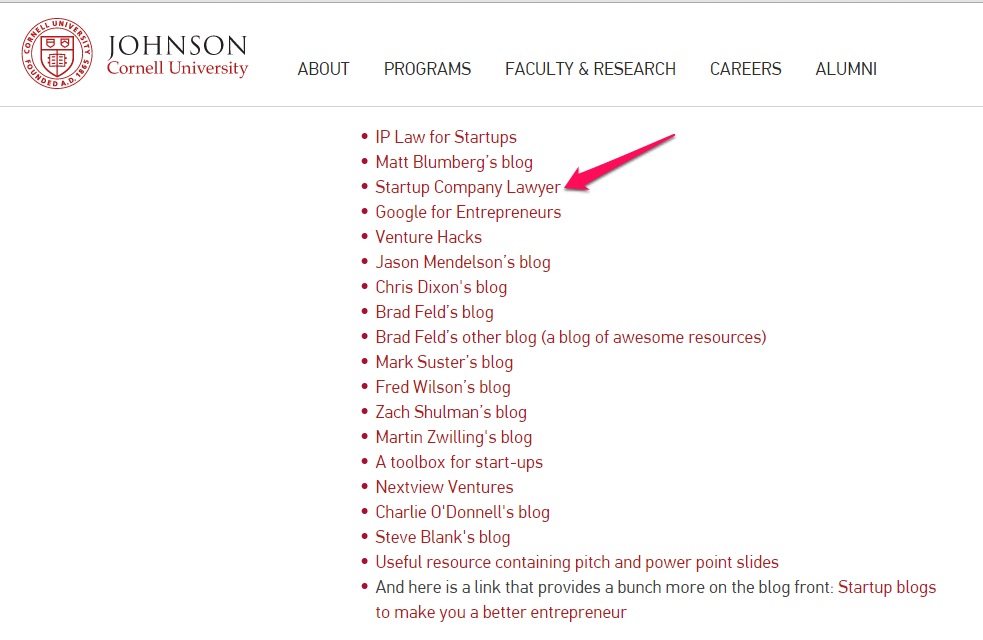
Running a query in Google will return hundreds and hundreds of resource pages in your niche.

Reach out to the webmaster and offer a link to your infographic.
Use the following template for reach out and it will do the trick.
5. Content curation
Do you know that you can build backlinks with the help of content curation?
You can.
Here’s how:
- Create a curated post that links to several industry experts and influencers. Talk about your infographic in the curated post.
- Publish it.
- Reach out to the influencers you’ve mentioned in the post.
- Post the article on social networks and mention influencers.
- If your post is great, expect backlinks from these experts.
6. Authority link building strategy
You have the infographic published, great.
It’s time to reach out to authority blogs in your niche and tell them about your infographic.
Don’t hesitate. Sending an email doesn’t cost you, right?
So reach out and tell them why your infographic is so awesome and why they should share it.
Step 7: Measure ROI
Time to measure the ROI of your infographic. After all, you’ve invested a whole lot of time and money on your infographic.
There are multiple metrics that you’ve to consider.
- ROI
- Page views
- Backlinks
- Traffic
- Search engine rankings
- Subscribers
- Leads
- Conversion rate
- Sales
- Engagement
- Social shares
- Embeds
You can go on and on.
The idea is to choose the most appropriate metric based on your objectives.
For instance, you spent a total of $1400 on infographic campaign (including design, distribution, and marketing). Now compare the performance metrics with the cost.
Is the engagement, social shares, leads, brand awareness, page views, etc. were worth $1400?
If so, repeat the strategy.
If not, tweak your strategy.
Conclusion
An infographic, which is a form of visual content is the second most important type of content. When it comes to visual content, nothing beats infographics.
Design your first masterpiece today.
If you enjoyed this article, you might enjoy this one too:

Researcher. Writer. Content marketer. Known for his killer headlines, well-researched articles and entrepreneurial spirit, Michael’s content can be found across the internet. Since signing-up for Fabrik, traffic, social interactions and rankings have gone through the stratosphere. No coincidence there, then.